I love bookish statistics, and what they reveal about people’s reading habits. I enjoy it when I come across them on other blogs (for example on Magic of Books), so even though I didn’t read a huge number of books in 2016 compared to other people I know, I thought it might still be fun to see what the stats on the humble selection I did read look like… and to satisfy my nerdy appreciation for graphs and charts.
This New-Year’s-flavoured post is coming a bit late, but don’t worry, I promise this is the last you’ll hear from me about 2016!
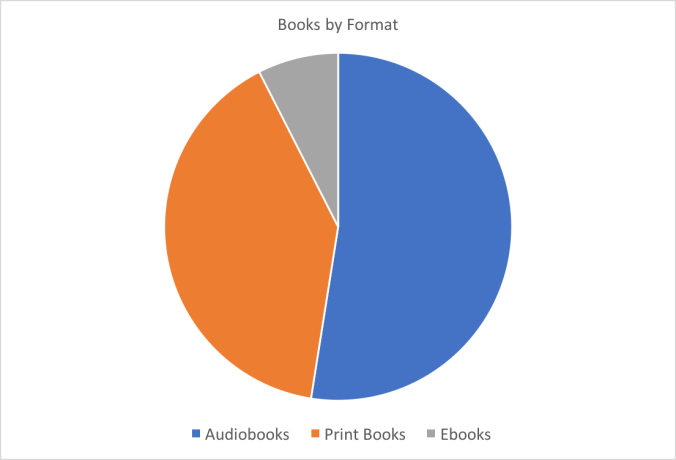
Audio vs Print vs Ebooks
I guess you can tell I’m a fan of audiobooks. I read more than 50% of my books this way last year, and had a similar percentage in 2015. However, I’m hoping to bump up the number of print books in 2017 simply so I can read more books in total, as I don’t think I can realistically listen to more than the 2 audiobooks per month I currently manage.
Genre
My genre preference is pretty obvious and the percentages are almost exactly the same as in the previous year. Believe it or not, I’m pleased at maintaining that 20% portion for ‘other’ books – given my reluctance to read anything outside of the spec-fic genres it could be lower!
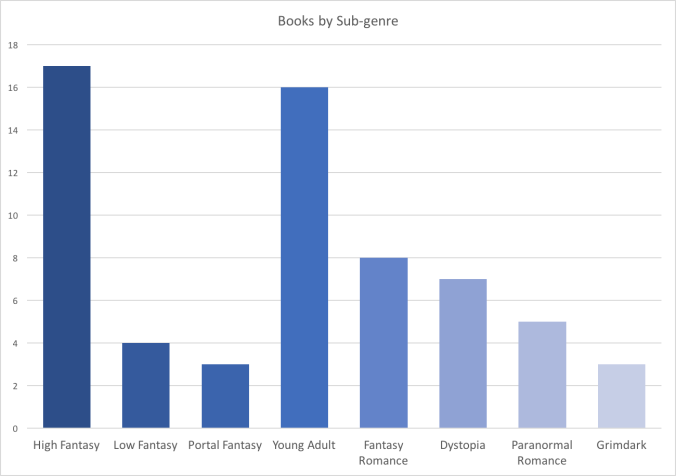
Sub-Genres
Here are the stats for a few key science fiction and fantasy sub-genres. Many of these are non-exclusive, so a book can fit several of them, i.e. a dystopia can also be a young adult novel and a low fantasy. (If you want to know how I define these sub-genres, see: 17 Common Fantasy Sub-Genres)
Year of Publication
In previous years I felt I wasn’t reading enough recently-published books, i.e. books published in the last two years. Looking at this graph, I think I can say I fixed that in 2016, though a portion of that is probably due to the fact I continued several series with recently-released sequels.
New Books vs Sequels
I am always tempted to read books by authors I’ve never read before because I love the thrill of discovering something new, but it can mean I leave a trail of unfinished series behind me. So last year I made a point of finally catching up with several series I had been intending to continue. While my new reads (i.e. first in a series and stand-alones) still outnumber my sequels, it’s nevertheless an increase for me.
Gender of Author
This is not something I feel I consciously think about when picking up a book, so I was curious to see the ratio. I admit I thought the female author percentage would be higher as I have the impression I’m mostly reading books by female authors, so it’s interesting to see that it was actually relatively even 58%-43% split last year.
___________
Well, those are my personal book stats for 2016, but if you’re interested in some trends and statistics from the publishing world in general, I can highly recommend this article on JaneFriedman.com (if you read it you’ll notice I’m not the only person who’s developed a partiality for audiobooks in the past few years!).
Do you have similar or different reading habits to mine? Did you notice any interesting trends in your reading last year, or have you heard any interesting tidbits about book statistics in general? Let me know in the comments!


Ooh I love all these gorgeous graphs!! And I love how you’ve divided out all of the types of fantasy you read! Kind of wish I’d done something like this so I could answer your question- all I know is I preferred the books I read in 2016 to 2015 and read more 4-5* books! (To be fair I read a lot of trash in 2015)
LikeLiked by 1 person
Ah that’s always great to feel like you’re reading lots of 4-5* books! Too many trashy books in a row can be depressing (when that happens I always need a really good one to remind me that reading can be far more enjoyable). And if you do end up doing any graphs/stats in future I’d be very interested to see them!
LikeLiked by 1 person
Yes definitely! Yes that’s for sure! Haha that’s true- I feel the same way! Aww thanks!
LikeLiked by 1 person
I have some doubts that the people who made this chart really understand the difference between the major genres. I don’t see how science fiction is larger than science fantasy. Most of the SF I see–well at least the popular stuff that becomes movies–is science fantasy. Pretty much all of the YA SF stuff is fantasy. But maybe that’s just the well advertised stuff. I don’t read as much as I should, so maybe I am way off.
LikeLike
That chart was for the books I read in 2016, not for the popularity of the genres overall, so it just means I personally read more science fiction than science fantasy. That said, my definition of science fiction is pretty liberal – as long as the book explains impossible happenings with science/technology I consider it science fiction (regardless of how plausible or implausible I think it is). It’s when a books starts to weave in more mysterious/magical things or uses fantasy tropes as well as sci-fi ones that I call it science fantasy. But I know my definition differs to others out there, and I’m sometimes undecided about which books I’d class as science fantasy, so I tend to just go with my gut feeling most of the time.
A lot of the popular YA books I encounter are futuristic dystopian stories that don’t comfortably fit in either SF or Fantasy… sometimes I just class them as ‘dystopia’ to get around having to decide!
LikeLike
Oh, these are your charts. I misunderstood that. I thought these were for industry wide. Sorry for the confusion. It makes sense now. Though its got me curious about the full sales numbers.
LikeLike
No worries! I’d also be curious to see the full sales numbers – I’ve often wondered how SF&F sales compare to each other and to other genres.
LikeLiked by 1 person
I most interested in know how they match to eachother, particularly how well hard sci-fi does compared to more escapist genres like fantasy and YA.
LikeLike
Thanks for the link-up 🙂
I see you’re much better than me in continuing the series. I had tons of started ones last year and I’ve got a goal to continue at least some of my favorites this year.
LikeLiked by 1 person
No worries, thanks for the inspiration! 🙂 I think I only managed to continue so many series because I made a conscious effort to, otherwise I would have read less (though I enjoyed it – was nice to finally get closure on some great stories). I hope you enjoy continuing your favourites this year!
LikeLiked by 1 person
I intend to 🙂
LikeLiked by 1 person
This and a BookTube video inspired me to track all sorts of things with my reading beyond what GoodReads normally gives you, so there will definitely be a whole lot of stats at the beginning of next year!
LikeLiked by 1 person
Great idea to start tracking things now! I worked these stats out retrospectively (with the help of Goodreads shelves) but it was cumbersome so would have been better to have kept track of things along the way. Anyway, I’ll be curious to see your stats next year!!
Oh, and do you have the link to that BookTube video by any chance? Just intrigued to see it 🙂
LikeLiked by 1 person
LikeLiked by 1 person
I have 1500 French Sci-Fi books, which I read in ten years. Therefore, it is easy to calculate how many books I read in a year. 🙂
LikeLiked by 1 person